Electricity & Carbon data
Visual storytelling
for case studies
Electricity maps
Illustration | Infographics | Visual storytelling
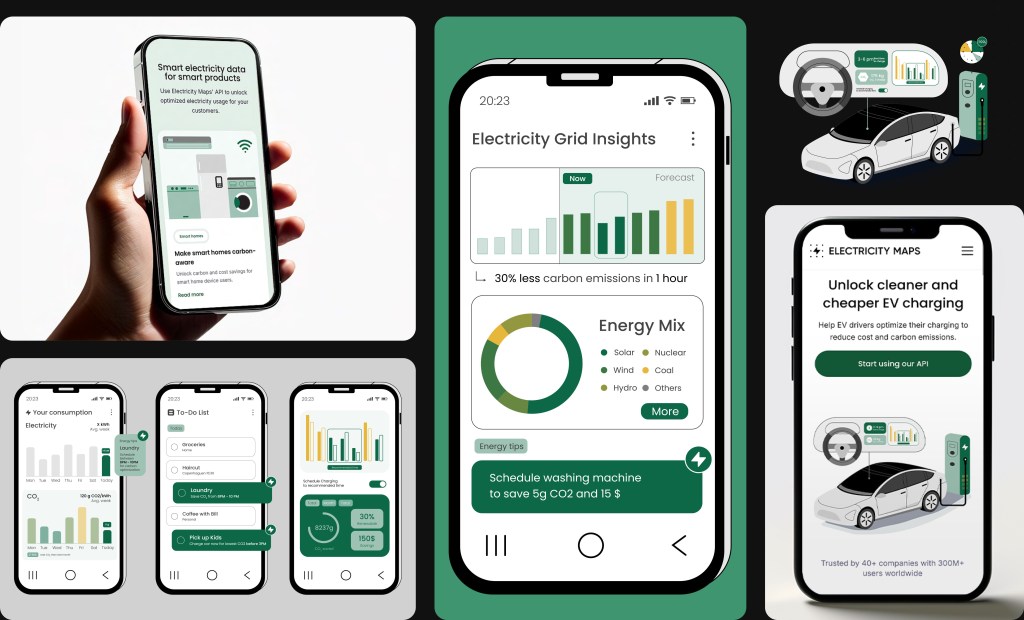
Tech & sustainability
Electricity Maps needed branded visuals to explain how their real-time electricity data powers tools like EV charging apps and smart energy planning. I created a set of illustrations and infographics that translated backend data processes into easy-to-understand visuals for case studies, customer outreach, and product explainers. The designs followed a minimalist, technical style consistent with the brand.